
Kuwait, a small country in the Persian Gulf, holds the sixth spot on the global GDP per capita ranking, with an average per capita income of over US$ 69,000 in 2015, adjusted at the purchasing power parity. At the same time, it ranked only 34th in the World Economic Forum’s 2015-2016 Global Competitiveness Index (GCI).
New Zealand, another relatively small country both in size and population, has a per capita wealth which is roughly only half that of Kuwait — a little over US$ 34,000 at the purchasing power parity, 35th place in the world. Nonetheless, New Zealand scored visibly higher in competitiveness, ranking 16th in the GCI.
Clearly, the two economies and their structures are not directly comparable. Kuwait’s heavy dependence on natural resource revenues (over 90 per cent of exports) provide for such a lush per capita value, while New Zealand’s GDP is stimulated primarily by services that dominate the local economy, at over 69 per cent. Competitiveness, both as a notion and an index, arguably transcends countries’ idiosyncrasies in relation to their economies’ compositions. Competitiveness is ultimately reliant on a set of universal and comparable parameters. Therefore, a logical question arises: why does this mismatch and others of similar nature happen?
Our tradition of measuring and understanding development and related components such as competitiveness has been dominated by the economic agenda. Conventionally, GDP and its derivatives have been employed to describe and substantiate changes in development. Often, they have revealed clear and important trends that can be useful when approaching policy implementation. For example, the World Economic Forum highlights that GDP per capita is highly correlated with GCI in large cross-county comparison.
Our own analysis has confirmed that GDP explains 69 per cent of the variation in GCI scores across 146 countries when both indexes are taken as averages for three years from 2014 to 2016 and an exponential model is used. At the same time, however, and exemplified by the above comparison between New Zealand and Kuwait, GDP per capita might not necessarily capture the full complexity of the nature of competitiveness at the macro level.
Moreover, there is large and growing body of research that shows that often, especially when a number of other parameters are controlled, GDP and GDP per capita might not explain development comprehensively when non-economic components are taken into account. It is becoming more evident that economic growth does not inevitably translate into quality changes in standards of life and opportunities for the average citizen. GDP and economic measures often sideline developmental concerns of social, environmental and personal nature. This could also be true for the social aspects of country competitiveness.
The Social Progress Index (SPI), an initiative developed by the Social Progress Imperative, an organisation formed by a group of scholars and business leaders, including Michael Porter, has been devised precisely to address the deficiency of economic measures in capturing true wide-ranging development. It measures exclusively social and environmental components, such as nutrition and basic medical care, access to information and communications, levels of tolerance and inclusion and the degree of personal freedoms and choice, among many others.
Overall, the index includes 50 measures of countries’ actual social and environmental product. This is a crucial and unique characteristic of the SPI, as it measures outcomes of development and performance of the society and economy in practical terms rather than purely measuring quantitative input that is only relevant in economic proxies. The sub-indices are aggregated into larger framework of three fundamental categories that conceptualise and approximate the phenomenon of social development: basic human needs, foundations of wellbeing, and opportunity.
SPI hence is intended, at the same time, to be a wider and more meaningful and detailed internal and cross-county measure that is expected to capture a more nuanced and accurate view of development and progress than a traditional analysis of macro-economic performance. It is envisioned to reveal those oftentimes hidden or unaccounted aspects of real conditions in a society that could be significantly more useful and appropriate for real policymaking.
For example, returning back to the mismatch between respective levels of GDP per capita and GCI ranks for Kuwait and New Zealand, SPI reveals that although, as mentioned, Kuwait enjoys significantly more wealth per person, New Zealand is, in turn, considerably better in terms of social progress than Kuwait. In 2015 and 2016, Kuwait ranked 42nd in SPI while New Zealand was among the best in the world, ranking 10th and 11th in 2015 and 2016 accordingly.
Although economic development has been stronger in Kuwait, we can see from the SPI that it did not translate into an inclusive social progress as measured by SPI. New Zealand, although a relatively poorer country, apparently has been able to better distribute and invest the benefits of economic growth into improving the social conditions and opportunities of its citizens. This fact can thus be potentially indicative to understand the difference and mismatch of competitiveness between these two countries that we have observed before. Social progress might be an important factor and foundation for competitive capacity of each country.
Our further analysis on a large cross-country level indeed demonstrates that the Social Progress Index is highly related with GCI. Based on the information from respective datasets we have calculated three-year averages of GCI (2014/2015 to 2016/2017) and four-year averages of SPI (2014–2017). The final sample conditioned by the availability of country data for both indices included 122 countries. A first look at the data reveals a clear and positive /relation between the two variables (figure 1). We note, however, that the trend is apparently not linear: as the country progresses socially, its competitiveness tends to increase more rapidly, which implies some form of exponential growth.
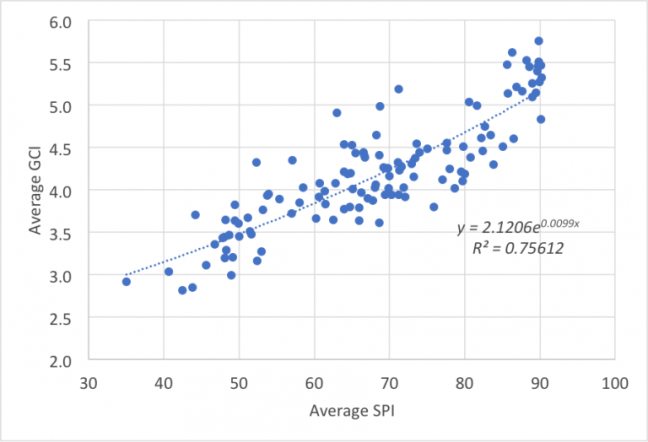
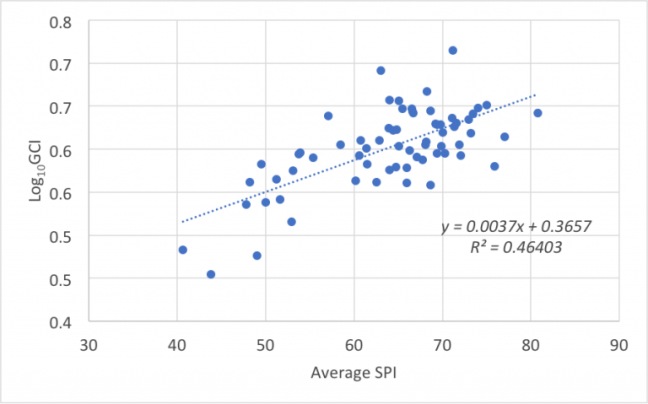
Indeed, plotting average SPI against log10GCI we see a very strong positive linear correlation (figure 2). Log10GCI is constructed by taking logarithm to the power 10 of the values of GCI. The logic for using logarithm is simple: by first constructing a graphic representation of the data (GCI vs SPI) we have observed a non-linear (exponential) pattern; logarithmic transformation was applied to linearise the relationship. Consequently, the findings are interpreted differently from a simple linear regression: we may say that a 1 point increase of SPI corresponds, on average, to a 0.43 per cent increase in GCI.
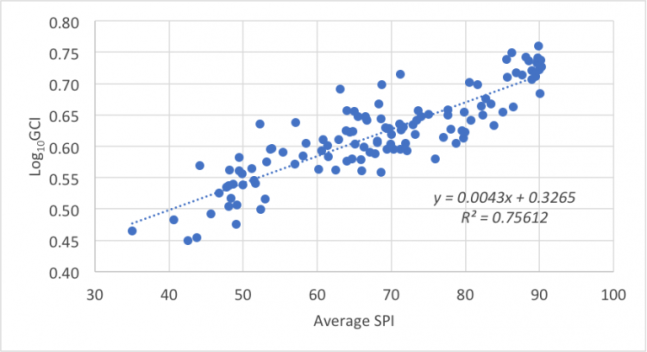
Linear regression of the data further confirmed that the observed correlations are statistically significant with the SPI coefficient significant at a 99.999 per cent confidence level. Furthermore, the second model, when we also control for GDP averages for the same countries for the same period, confirms that, even when economic performance is accounted for, SPI continues to be very significant (at a 99.999 per cent confidence level) with the model explaining now over 78 per cent of the GCI variance.
We have also analysed respective correlations of SPI and GCI within countries of the same income level (without controlling for GDP). We used the standard classification of countries by their income level from the World Bank where, however, we combined all of the countries in the Middle-Income group, without differentiation by the lower and upper middle. We also additionally reviewed a group of countries composed of OECD members, which are primarily located within the rightmost sector (figure 3):
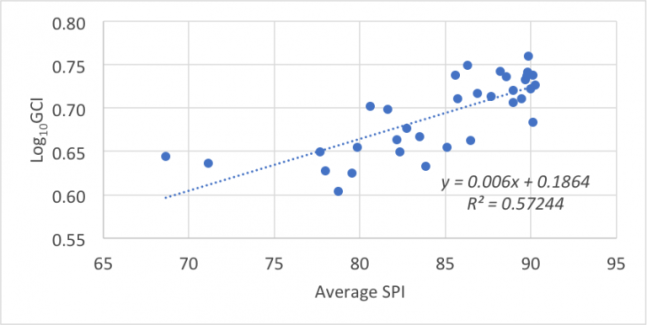
Although the pattern is less clear, nonetheless, it is still positive and rather strong: developed countries seem to become increasingly more competitive as their social progress advances. Below are also the results of per group analyses (figures 4, 5, 6):
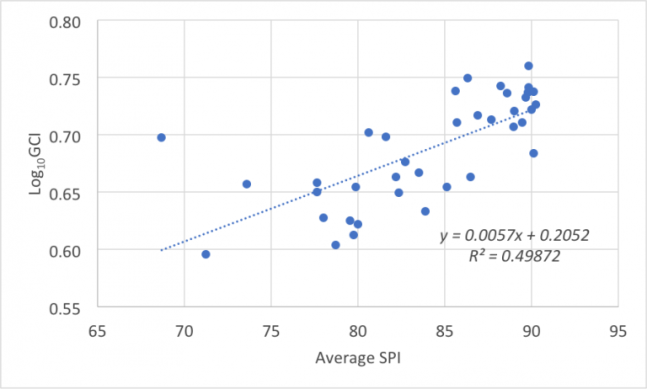
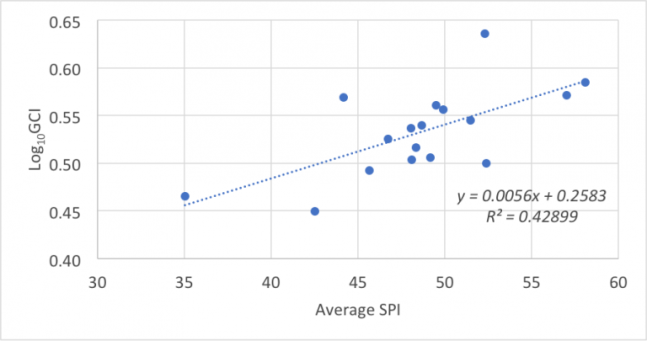
As can be observed, although the relationship is less powerful when countries are separated into income groups (where SPI explains between 42% and 49% of the variation of the GCI), which can be also a result of decreased samples sizes (Low-Income had only 17 countries while High – 38 and Middle – 67), the correlation is still reasonably strong and significant. This, hence, might signal that even within the same average level of income the countries that show better level of social progress tend to have larger level of competitiveness. This fact provides additional plausible confirmation of the original assumption that SPI and GCI are meaningfully connected.
Overall, the most important consideration is that we observe, in both original models, clear and strong correlation of SPI with GCI. SPI in the larger sample explains over 75% of the GCI variability. These are important results, as they might suggest, assuming a causality in the nature of the relationship and accounting for the exponential nature of the correlation, that even a rather small increase in social progress levels would promote a relatively larger increase in competitiveness of the country.
Indeed, the analysis would need further verification and additional research on a more detailed basis would provide superior results into the role of SPI. However, we believe that the present evidence seems to suggest that social progress or social development factors are central for increasing competitiveness and, ultimately, prosperity of the country and its population. From this perspective investing in issues such as healthcare, education and the environment becomes not just a result of political calculation but a matter of the overall economic growth and influence competitive advantage a country will have on a global scale.
Sound social policy turns thus into an element of country’s performance that would require dedicated attention. SPI in this sense could play an important role in understanding where each society stands and which social components need improvement. The nuanced image of social development that SPI offers could be used as leverage for policy makers as it allows for precision and efficiency in policy making that would be addressing real social issues that could, in the end, have an effect on the competitiveness of the country and increasing opportunities for its people. SPI might become a practical tool of primary analysis of the situation on the high-level. Developing SPI further, increasing its robustness and coverage, and improving awareness of the index on different levels of policy decision would be a positive strategy for understanding and encouraging competitiveness and ultimately, development in general.


 Nicolas Bouzou, est un essayiste français libéral spécialisé dans l’économie. Il est diplômé de l’université Paris-Dauphine et a un master de finance de l’IEP de Paris. Il a été pendant six ans analyste en chef de l’institut de prévisions Xerfi. Il a depuis 2006 fondé sa propre entreprise, Asterès, une société d’analyse économique et de conseil.